
Bar Charts and Graphs in Asp.net mvc
Hi friends,
Yesterday i came across a scenario where i needed to display mt data in pictorial format to user for readability, i was searching some jquery plugin to achieve that so that i can make graphs and bar charts in my application and i found many plugins but the one i found best for me was http://www.highcharts.com/
it has a lot of data representation controls available, i used one of this.
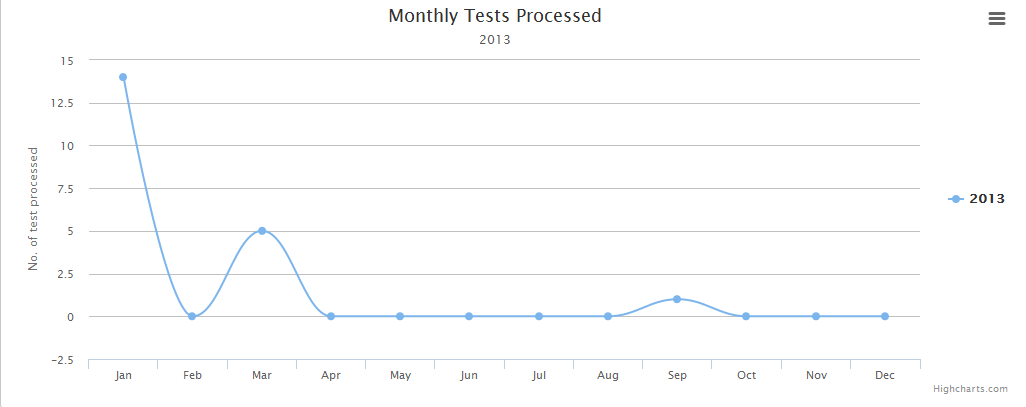
The output of it looks like :

Here is the way how you can build a bar chart or graph:
For making chart or graph first we have to add these lines in the view:
now add a div in view which will contain the chart, it will be our container :
Now you add this code in your view, for understanding there is static data here passed but you can get data via Ajax or get in action and on view use it in this function:
but in the below view you will see i am filling data dynamically by getting from server side that will make you better understand.
If you have any question you can ask me in comments. Thanks.
Yesterday i came across a scenario where i needed to display mt data in pictorial format to user for readability, i was searching some jquery plugin to achieve that so that i can make graphs and bar charts in my application and i found many plugins but the one i found best for me was http://www.highcharts.com/
it has a lot of data representation controls available, i used one of this.
The output of it looks like :

Here is the way how you can build a bar chart or graph:
For making chart or graph first we have to add these lines in the view:
<script src="http://code.highcharts.com/highcharts.js"></script>
<script src="http://code.highcharts.com/modules/exporting.js"></script>
now add a div in view which will contain the chart, it will be our container :
<div id="myDiv" style="min-width: 310px; height: 400px; margin: 0 auto"></div>
Now you add this code in your view, for understanding there is static data here passed but you can get data via Ajax or get in action and on view use it in this function:
<script type="text/javascript">
                      var chart1;
                      $(document).ready(function () {
                          chart1 = new Highcharts.Chart({
                              chart: {
                                  type: 'spline',
                                  renderTo: 'myDiv'
                              },
                              title: {
                                  text: 'Monthly Tests Processed',
                                  x: -20 //center
                              },
                              subtitle: {
                                  text: '2013',
                                  x: -20
                              },
                              xAxis: {
                                  categories: ['Jan', 'Feb', 'Mar', 'Apr', 'May', 'Jun',
                    'Jul', 'Aug', 'Sep', 'Oct', 'Nov', 'Dec']
                              },
                              yAxis: {
                                  title: {
                                      text: 'No. of test processed'
                                  },
                                  plotLines: [{
                                      value: 0,
                                      width: 1,
                                      color: '#808080'
                                  }]
                              },
                              tooltip: {
                                  valueSuffix: 'Tests Processed'
                              },
                              legend: {
                                  layout: 'vertical',
                                  align: 'right',
                                  verticalAlign: 'middle',
                                  borderWidth: 0
                              },
                              series: [{
                                  name: '2013',
                                  data: [10, 20, 8, 40, 21, 90, 60, 44, 0, 35, 16,41]
                              }]
                          });
                      });


  </script>
but in the below view you will see i am filling data dynamically by getting from server side that will make you better understand.
Controller Action
Here is my controller code:
public class DashboardController : Controller
    {
        //
        // GET: /Dashboard/

        public ActionResult Index()
        {

            if (Session["user"] != null)
            {

                Session["ViewFlag"] = "Dashboard";

                DashboardViewModel objDashboardViewModel = new DashboardViewModel();


                return View(objDashboardViewModel.GetVerifiedTests((long)Session["userID"]));
            }

            else
            {
                return RedirectToAction("Index", "Home");
            }
        }


    }
View Model
Here is my view model code:
public class DashboardViewModel
{
 public int YearCount { get; set; }
 public int TodayCount { get; set; }
 public int TodayOverdueCount { get; set; }
 public int TodayOnTimeCount { get; set; }
 public int JanuaryCount { get; set; }
 public int FabruaryCount { get; set; }
 public int MarchCount { get; set; }
 public int AprilCount { get; set; }
 public int MayCount { get; set; }
 public int JuneCount { get; set; }
 public int JulyCount { get; set; }
 public int AugustCount { get; set; }
 public int SeptemberCount { get; set; }
 public int OctoberCount { get; set; }
 public int NovemeberCount { get; set; }
 public int DecemberCount { get; set; }

 public DashboardViewModel GetEnteredTests(long PersonID)
 {

 DashboardViewModel objDashboardViewModel = new DashboardViewModel();

 using (var db = new bc_limsEntities())
 {
  var result = (from r in db.dc_tresult

                join tr in db.dc_tstatustrack
                on r.bookingdid equals tr.bookingdid
                where tr.processid == 5
                && tr.enteredby == PersonID

               select new { r.bookingdid, r.enteredon }).Distinct();


 int totalCounter = 0;
 int todayCounter = 0;
 int janCounter = 0;
 int febCounter = 0;
 int marCounter = 0;
 int aprCounter = 0;
 int mayCounter = 0;
 int junCounter = 0;
 int julCounter = 0;
 int augCounter = 0;
 int sepCounter = 0;
 int octCounter = 0;
 int novCounter = 0;
 int decCounter = 0;

 foreach (var item in result)
 {
   if(item.enteredon.Month == 1 && item.enteredon.Year == DateTime.Now.Year)
   {
    janCounter ++;
   }
   if (item.enteredon.Month == 2 && item.enteredon.Year == DateTime.Now.Year)
   {
    febCounter++;
   }
   if (item.enteredon.Month == 3 && item.enteredon.Year == DateTime.Now.Year)
   {
    marCounter++;
   }
   if (item.enteredon.Month == 4 && item.enteredon.Year == DateTime.Now.Year)
   {
    aprCounter++;
   }
   if (item.enteredon.Month == 5 && item.enteredon.Year == DateTime.Now.Year)
   {
    mayCounter++;
   }
   if (item.enteredon.Month == 6 && item.enteredon.Year == DateTime.Now.Year)
   {
    junCounter++;
   }
   if (item.enteredon.Month == 7 && item.enteredon.Year == DateTime.Now.Year)
   {
   julCounter++;
   }
   if (item.enteredon.Month == 8 && item.enteredon.Year == DateTime.Now.Year)
   {
    augCounter++;
   }
   if (item.enteredon.Month == 9 && item.enteredon.Year == DateTime.Now.Year)
   {
    sepCounter++;
   }
   if (item.enteredon.Month == 10 && item.enteredon.Year == DateTime.Now.Year)
   {
    octCounter++;
   }
   if (item.enteredon.Month == 11 && item.enteredon.Year == DateTime.Now.Year)
   {
    novCounter++;
   }
   if (item.enteredon.Month == 12 && item.enteredon.Year == DateTime.Now.Year)
   {
    decCounter++;
   }
   if (item.enteredon == DateTime.Now)
   {
    todayCounter++;
   }
   if (item.enteredon.Year == DateTime.Now.Year)
   {
    totalCounter++;
   }


}


objDashboardViewModel.TodayCount = todayCounter;
objDashboardViewModel.YearCount = totalCounter;
objDashboardViewModel.JanuaryCount = janCounter;
objDashboardViewModel.FabruaryCount = febCounter;
objDashboardViewModel.MarchCount = marCounter;
objDashboardViewModel.AprilCount = aprCounter;
objDashboardViewModel.MayCount = mayCounter;
objDashboardViewModel.JuneCount = junCounter;
objDashboardViewModel.JulyCount = julCounter;
objDashboardViewModel.AugustCount = augCounter;
objDashboardViewModel.SeptemberCount = sepCounter;
objDashboardViewModel.OctoberCount = octCounter;
objDashboardViewModel.NovemeberCount = novCounter;
objDashboardViewModel.DecemberCount = decCounter;

return objDashboardViewModel;

     }
   }
}
Here is my View :
<div class="grid">

              <div class="grid-title">
               <div class="pull-left">
                  <div class="icon-title"><i class="icon-eye-open"></i></div>
                  <span>Dashboard</span>
                  <div class="clearfix"></div>
               </div>
               <div class="pull-right">
                  <div class="btn-group" style="margin-top:4px;margin-right:4px;">
                 @* <button class="btn">Verified Today</button>*@
                  @*<button class="btn">Last Week</button>
                  <button class="btn">Last Month</button*@>
                </div>
               </div>
              <div class="clearfix"></div>
              </div>

              <div class="clearfix"></div>

              <div class="grid-content overflow">

              <div style="position:relative;">
              <h3>Today's Processed</h3><span>@Model.TodayCount</span>
              <h3>2013 Total</h3><span>@Model.YearCount</span>

                  <script type="text/javascript">
                      var chart1;
                      //data: [january, '@Model.FabruaryCount', '@Model.MarchCount', '@Model.AprilCount', '@Model.MayCount', '@Model.JuneCount', '@Model.JulyCount', '@Model.AugustCount', '@Model.SeptemberCount', '@Model.OctoberCount', '@Model.NovemeberCount', '@Model.DecemberCount']
                      var january = @Model.JanuaryCount;
                      $(document).ready(function () {
                          chart1 = new Highcharts.Chart({
                              chart: {
                                  type: 'spline',
                                  renderTo: 'myDiv'
                              },
                              title: {
                                  text: 'Monthly Tests Processed',
                                  x: -20 //center
                              },
                              subtitle: {
                                  text: '2013',
                                  x: -20
                              },
                              xAxis: {
                                  categories: ['Jan', 'Feb', 'Mar', 'Apr', 'May', 'Jun',
                    'Jul', 'Aug', 'Sep', 'Oct', 'Nov', 'Dec']
                              },
                              yAxis: {
                                  title: {
                                      text: 'No. of test processed'
                                  },
                                  plotLines: [{
                                      value: 0,
                                      width: 1,
                                      color: '#808080'
                                  }]
                              },
                              tooltip: {
                                  valueSuffix: 'Tests Processed'
                              },
                              legend: {
                                  layout: 'vertical',
                                  align: 'right',
                                  verticalAlign: 'middle',
                                  borderWidth: 0
                              },
                              series: [{
                                  name: '2013',
                                  data: [@Model.JanuaryCount, @Model.FabruaryCount, @Model.MarchCount, @Model.AprilCount, @Model.MayCount, @Model.JuneCount, @Model.JulyCount, @Model.AugustCount, @Model.SeptemberCount, @Model.OctoberCount, @Model.NovemeberCount,@Model.DecemberCount]
                              }]
                          });
                      });


  </script>
 <script src="http://code.highcharts.com/highcharts.js"></script>
<script src="http://code.highcharts.com/modules/exporting.js"></script>
<div id="myDiv" style="min-width: 310px; height: 400px; margin: 0 auto"></div>


              </div>

              </div>

</div>
If you have any question you can ask me in comments. Thanks.


2 comments
Write commentsalso review jqplot
Replythis plugin is very strong in my point of view, it provides satistics charts, pie charts and much more you juct checjk out demos on it site.
Reply